


LPG Affordability in India: Why Income-Based Comparisons Tell a Different Story Than Cylinder Prices Alone
When governments, oil marketing companies, and industry reports compare liquefied petroleum gas (LPG) prices across countries, the focus is often on the nominal retail price of a cylinder. By that measure, India frequently appears to be among the countries with relatively lower LPG prices compared with developed economies such as the United States, Canada, and Australia.
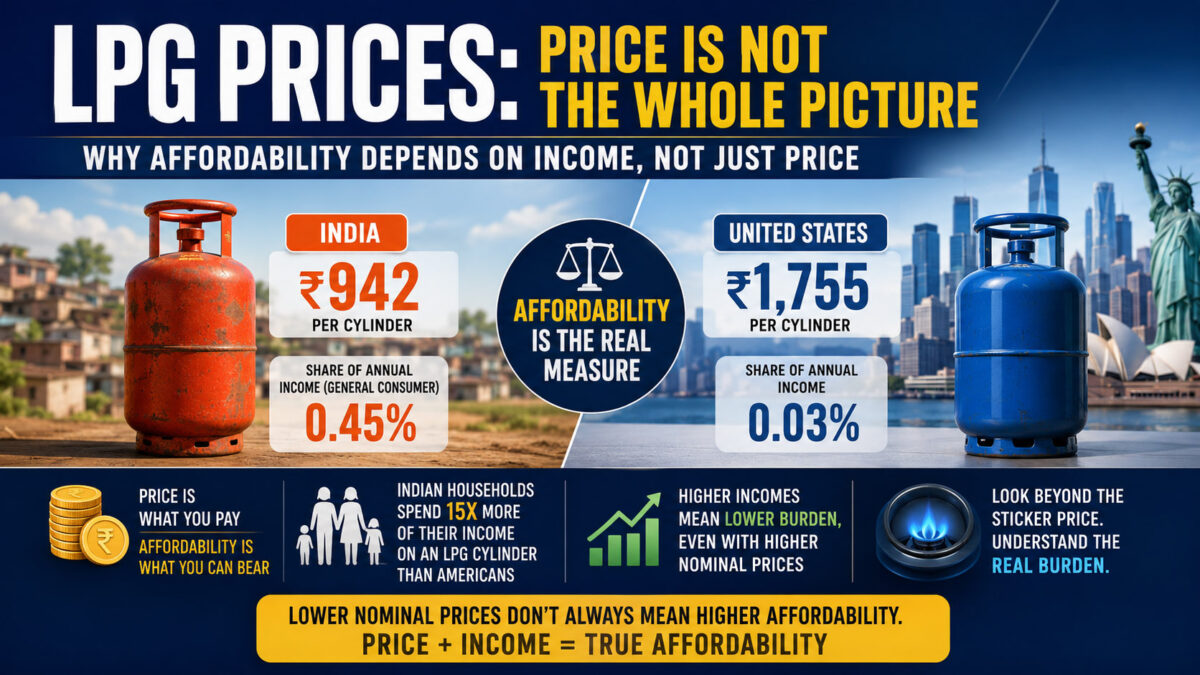
However, economists and energy-policy experts argue that nominal price comparisons provide only part of the picture. A more meaningful measure of affordability is the share of income required to purchase a cylinder. Viewed through that lens, the affordability story changes significantly.
Price Alone Does Not Measure Affordability
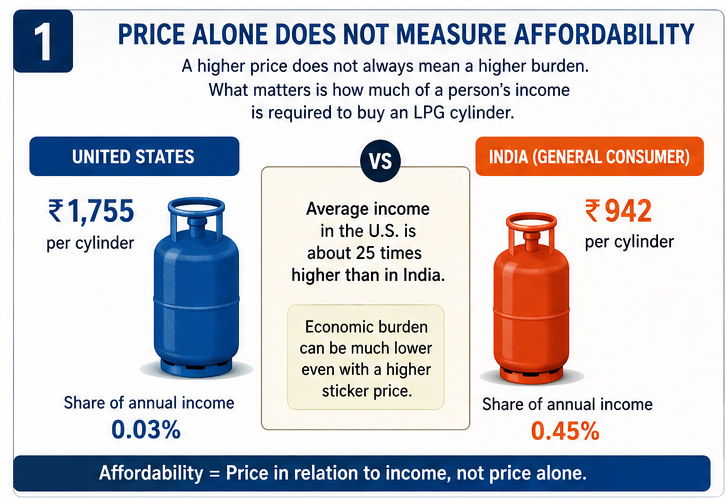
A consumer does not experience energy costs in isolation. What matters is how much of their income must be spent to obtain that energy.
For example, an LPG cylinder priced at ₹1,755 in the United States appears far more expensive than a ₹942 cylinder in India. Yet average incomes in the United States are dramatically higher than in India. As a result, the economic burden on consumers can be much lower despite the higher sticker price.
This distinction between price and affordability is widely recognized in economic analysis. Affordability is generally assessed using metrics such as purchasing power, household income, and the proportion of income devoted to essential goods and services.
Comparing LPG Costs as a Share of Annual Income
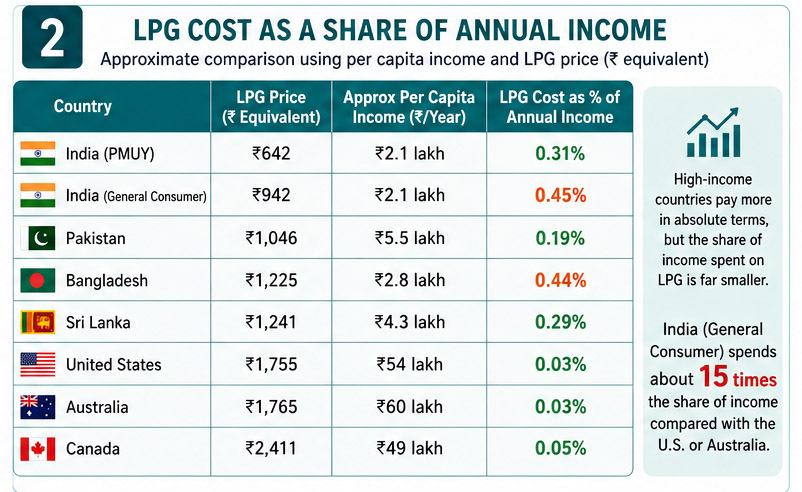
Using approximate recent per-capita annual income figures and LPG cylinder prices converted into Indian rupees for comparison, the affordability picture becomes clearer.
| Country | LPG Price (₹ Equivalent) | Approx Per Capita Income (₹/Year) | LPG Cost as % of Annual Income |
|---|---|---|---|
| India (PMUY) | ₹642 | ₹2.1 lakh | 0.31% |
| India (General Consumer) | ₹942 | ₹2.1 lakh | 0.45% |
| Pakistan | ₹1,046 | ₹5.5 lakh | 0.19% |
| Bangladesh | ₹1,225 | ₹2.8 lakh | 0.44% |
| Sri Lanka | ₹1,241 | ₹4.3 lakh | 0.29% |
| United States | ₹1,755 | ₹54 lakh | 0.03% |
| Australia | ₹1,765 | ₹60 lakh | 0.03% |
| Canada | ₹2,411 | ₹49 lakh | 0.05% |
The figures suggest that while consumers in high-income countries often pay substantially more in absolute terms, the share of income required to purchase a cylinder is much smaller.
For a general LPG consumer in India, one cylinder represents approximately 0.45% of annual per-capita income. In contrast, an equivalent cylinder in the United States or Australia represents only about 0.03% of annual income.
The Burden Gap Between India and Developed Economies
The comparison highlights a significant affordability gap.
Based on these estimates:
- An Indian non-subsidized consumer spends roughly 15 times the share of income on an LPG cylinder compared with an average American.
- The burden is also about 15 times higher than in Australia.
- Compared with Canada, the burden is approximately nine times greater.
These comparisons do not imply that LPG pricing policies are identical across countries. Tax structures, subsidies, transportation costs, and market dynamics differ significantly. However, they illustrate why affordability cannot be assessed solely by comparing retail prices.
Monthly Income Provides Another Useful Perspective
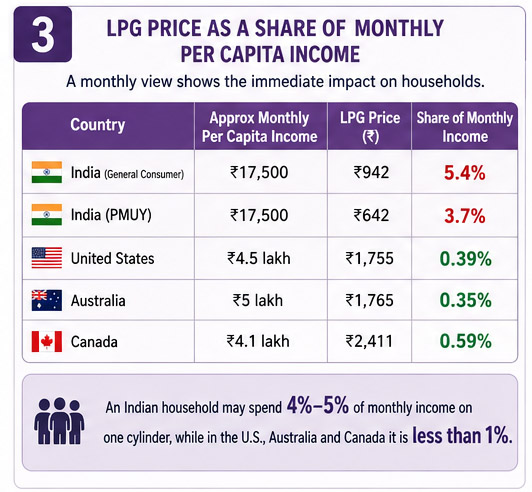
Annual income statistics can sometimes feel abstract. Looking at monthly income offers a more immediate view of the financial impact on households.
| Country | Approx Monthly Per Capita Income | LPG Price | Share of Monthly Income |
|---|---|---|---|
| India (General Consumer) | ₹17,500 | ₹942 | 5.4% |
| India (PMUY) | ₹17,500 | ₹642 | 3.7% |
| United States | ₹4.5 lakh | ₹1,755 | 0.39% |
| Australia | ₹5 lakh | ₹1,765 | 0.35% |
| Canada | ₹4.1 lakh | ₹2,411 | 0.59% |
The difference becomes more pronounced when viewed this way.
An Indian household purchasing a cylinder may spend between 4% and 5% of a month’s per-capita income on a single refill. In contrast, consumers in the United States, Australia, and Canada typically spend less than 1% of monthly income on the same purchase.
For families managing tight household budgets, such differences can influence fuel consumption patterns, refill frequency, and overall energy access.
Measuring Affordability Through Purchasing Power
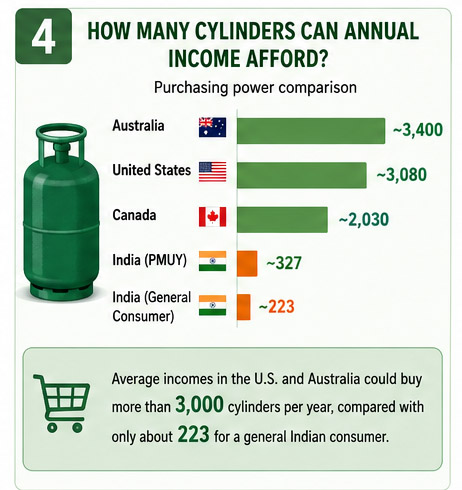
Another useful way to assess affordability is to ask a simple question: how many cylinders could an average person’s annual income purchase?
| Country | Cylinders Affordable With Annual Per Capita Income |
|---|---|
| India (General Consumer) | ~223 |
| India (PMUY) | ~327 |
| United States | ~3,080 |
| Australia | ~3,400 |
| Canada | ~2,030 |
Under this approach, the purchasing power gap becomes stark.
Average incomes in the United States and Australia could theoretically buy more than 3,000 LPG cylinders per year, compared with roughly 223 cylinders for a general Indian consumer. The comparison underscores the substantial differences in income levels that influence real-world affordability.
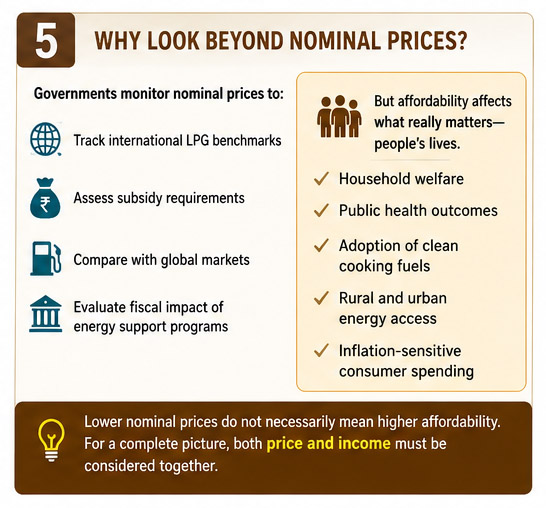
Why Governments Emphasize Nominal Prices
Government agencies and oil companies often focus on nominal LPG prices for several reasons.
These include:
- Monitoring international LPG benchmarks.
- Assessing subsidy requirements.
- Comparing domestic retail prices with global markets.
- Evaluating fiscal impacts of energy support programs.
Such measures are important for policy decisions and budget planning. India has also implemented targeted support schemes such as the Pradhan Mantri Ujjwala Yojana (PMUY), which aims to improve clean cooking fuel access for lower-income households.
Yet nominal price comparisons alone do not capture the consumer experience.
A lower price does not automatically translate into greater affordability if incomes are proportionately lower.
The Broader Energy Affordability Debate
Energy economists increasingly emphasize affordability metrics that account for income and purchasing power. Similar approaches are used when evaluating electricity tariffs, housing costs, transportation expenses, and healthcare spending.
For policymakers, the distinction matters because energy affordability affects:
- Household welfare.
- Public health outcomes.
- Adoption of clean cooking fuels.
- Rural and urban energy access.
- Inflation-sensitive consumer spending.
In countries where income growth lags behind energy costs, even relatively low nominal prices can place pressure on household budgets.
A More Complete Picture
The debate over LPG affordability illustrates the importance of context in international comparisons.
India’s LPG prices may indeed be lower in absolute rupee terms than those found in many developed countries. However, when measured against average income, the burden on consumers is significantly higher.
A comprehensive assessment therefore requires looking beyond the retail price displayed at the point of sale. Purchasing power, income levels, and the share of household expenditure devoted to energy provide a fuller understanding of what consumers actually experience.
The key takeaway is straightforward: lower nominal prices do not necessarily mean higher affordability. For meaningful international comparisons, both price and income must be considered together.